Every log is a data point. Every season is a dataset.
Start with a simple trip log. STAT auto-captures weather, scores your outing, ties it to your locations, and feeds it all into a personal analytics engine that gets smarter every time you go out.
Every log trains your personal ML model. STAT builds graphs, surfaces averages, scores performance, and sharpens predictions. The more you log, the smarter it gets.
Interactive charts reveal what conditions drive activity. Spot trends across seasons, compare locations, and know exactly when to be in the stand before the moment passes.
Every log auto-generates weather patterns, performance scores, location analytics & AI predictions
Built for every pursuit


The Platform
Your outdoor journal, powered by data
STAT Outdoors is an analytical platform for hunters and anglers who want more than a logbook. Every trip feeds into a personalized dataset that reveals patterns, scores performance, and surfaces insights you'd never spot on your own.
Sound familiar?
Log
Capture every detail of your trips with sport-specific fields. Weather data auto-fills based on your time and location.
Analyze
STAT scores your logs, aggregates location data, and delivers dashboard analytics with seasonal insights and trends.
Predict
AI-powered weather patterning and ML predictions for hunting and fishing help you pick the optimal days to be in the field or on the water.
Features
Every tool you need, nothing you don't
Purpose-built features for the serious outdoorsman who wants data, not clutter.
Logbook
Keep detailed logs. Get detailed data.
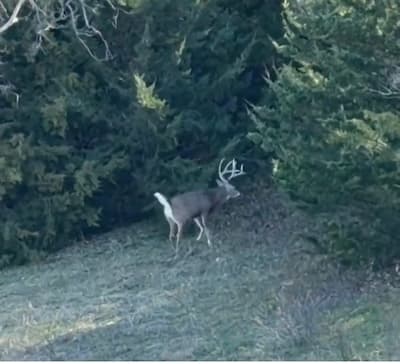
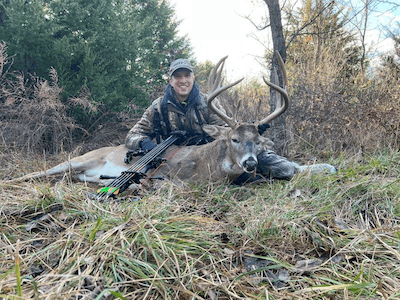
Every pursuit has its own set of fields designed to capture what matters. Log a deer hunt, a turkey hunt, or a fishing trip each with unique data points tailored to that sport. Weather fills in automatically. Your photos preserve the memories. And behind the scenes, STAT is building your dataset.
Trip Planner
Plan smarter with machine learning
Stop guessing when to go. STAT Vision analyzes your past trip data alongside real weather conditions to predict game movement. Look at what worked this time last year, find similar weather conditions from past successes, and get morning and evening predictions four days out.
Available for Deer & Fishing trips
Spots & Areas
Know your ground. Down to the stand.
Create Spots to represent your hunting and fishing locations, then link every trip to them. Spots aggregate all your data and surface location-specific insights. Share Spots with friends to pool data and collaborate. Break Spots into Areas for granular, stand-level intelligence.
Insights & Season Reports
Your data, visualized
Every log you create feeds into a personal analytics engine. STAT crunches the numbers and delivers insights, graphs, and seasonal reports so you can see what's working, what's changed, and where to focus next. The more you log, the smarter it gets.
STAT Report Card · PRO
Every trip graded against your history
After every trip, STAT hands you a report card. A 0-5 star rating of the day's conditions, the exact factors that drove the score, and a full breakdown of how the conditions, your setup, and your results stacked up against your personal averages. No generic scores. It's all measured against what has actually worked for you.
STAT rated the conditions solid · a typical deer day for you
Days like this have averaged 5.3 deer for you.
5 things in your favor, 2 against, vs your history.
Weather Patterning
Predict movement with atmospheric data
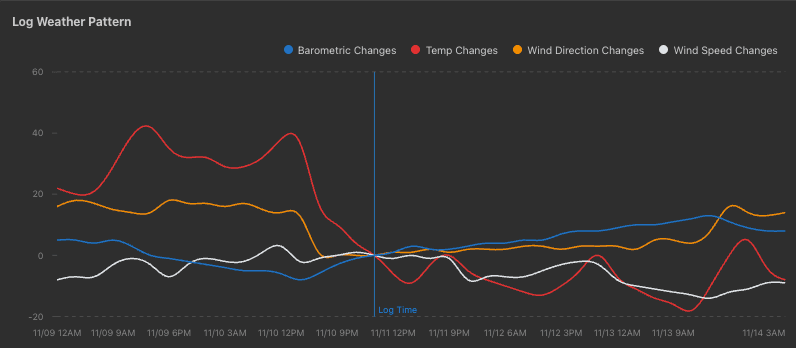
Can you predict when deer will be on their feet or when the fish will be biting? The answer might be in what the weather was—or what it's about to be.
Each log automatically captures a weather pattern with 160+ data points, including barometric pressure readings every 3 hours across a 4-day window: 2 days before and 2 days after each trip.
Interactive graphs reveal relationships between atmospheric changes and wildlife activity, giving you powerful insight into the conditions that drive game movement and fish activity.
Pricing
Simple, transparent pricing
Start for free, upgrade when you're ready.
Basic
Ad-free with generous limits. Everything you need to get started.
- Trip logging across all sport categories
- Basic spot tracking
- Trophy management
- Dashboard analytics
- Profile & badge system
- Ad-free experience
PRO
or $79.99/yr
Unlock the full analytical power of STAT Outdoors.
- Everything in Basic
- Trail camera management
- Trail camera sighting logs
- Weather Patterns
- Weather Pattern Alerts (cold fronts, wind shifts & more)
- STAT Report Card: every trip scored vs your history
- Unlimited Spots
- Unlimited Trophies
- Advanced analytics & insights
- Priority support
- All future PRO features
Subscribe direct on the web: $59.99/yr, or just $29.99 your first year with code FIRSTYEAR. Lock in the limited-time STAT Founding Lifetime for a one-time $249.
Go PROGet Involved
Join the STAT Field Staff
We're looking for serious outdoorsmen to help shape the future of STAT. Get a free PRO subscription in exchange for your honest feedback.
FAQ
Frequently asked questions
Everything you need to know about STAT Outdoors.
What is STAT Outdoors?
STAT Outdoors is a data-driven hunting and fishing app for iOS, Android, and web. It combines trip logging with automatic weather data capture, AI-powered predictions, and personal analytics to help hunters and anglers understand what conditions drive game activity. Every trip log generates 160+ weather data points and feeds a personal analytics engine that gets smarter the more you use it.
What sports does STAT Outdoors support?
STAT Outdoors supports six sport categories: deer hunting, turkey hunting, waterfowl hunting, upland bird hunting, varmint hunting, and fishing. Each category has its own set of sport-specific fields designed to capture what matters for that pursuit, so you never have to use a generic, one-size-fits-all form.
How does weather patterning work for hunting and fishing?
Each trip log automatically captures a weather pattern with 160+ data points, including barometric pressure readings every 3 hours across a 4-day window (2 days before and 2 days after your trip). Interactive graphs reveal the relationship between atmospheric changes and wildlife or fish activity, helping you identify the conditions that drive deer movement or productive fishing at your specific locations.
How much does STAT Outdoors cost?
STAT Outdoors offers a free Basic membership that includes trip logging across all sport categories, basic spot tracking, trophy management, dashboard analytics, and an ad-free experience. The PRO subscription costs $9.99 per month or $79.99 per year and unlocks weather patterns, weather pattern alerts (push notifications for cold fronts, warm fronts, wind direction shifts, and high STAT Vision probability), the STAT Report Card (a 5-star rating of every trip's conditions with a full report comparing them against your personal history), trail camera management, unlimited spots and trophies, advanced analytics, and priority support. You can also subscribe direct on the web for $59.99 per year (25% off), and for a limited time you can lock in lifetime PRO access with the STAT Founding Lifetime membership for a one-time $249.
What is STAT Vision and how do the predictions work?
STAT Vision is the machine learning engine built into STAT Outdoors. It analyzes your personal trip history alongside real weather conditions to predict game movement. You can review logs from the same time of year, find past trips with similar weather conditions, and get morning and evening predictions up to 4 days out. It includes Deer Vision, Rut Vision, and Fishing Vision models tuned specifically for each sport.
Can I share data with other hunters?
Yes. STAT Outdoors lets you create Spots to represent your hunting and fishing locations, then share them with other users. Everyone who contributes data to a shared Spot benefits from the pooled insights. You can also break Spots into Areas for granular, stand-level or cove-level analytics.
What platforms is STAT Outdoors available on?
STAT Outdoors is available on iOS (iPhone and iPad), Android, and the web. Your data syncs across all platforms, so you can log a trip on your phone in the field and review your analytics on a tablet or computer at home.
Does barometric pressure really affect deer movement and fishing?
Many experienced hunters and anglers believe that changes in barometric pressure correlate with increased deer activity and fish feeding, particularly when pressure is rising after a front passes or during a sustained pressure drop. STAT Outdoors captures barometric pressure readings every 3 hours so you can analyze the relationship between pressure changes and the activity you observe. Whether in the stand or on the water, building a personal dataset that goes beyond anecdotal evidence.
Download
Start logging today
Available everywhere you hunt.
Contact
Get in touch
Have a question or feature request? We'd love to hear from you.
Feature Requests
STAT is constantly evolving. Have an idea? We want to hear it.